Plotting my research notes with NetworkX and sigma.js
Posted on Sat 21 September 2019 in data science
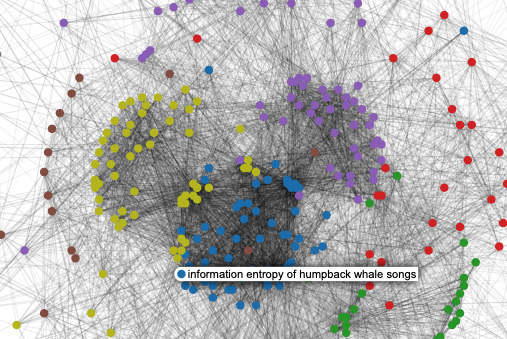
Hover over a node to see the title of the paper. Click on the node to see the connected Papers. Scroll to zoom in or out. Click and drag to move around network space. Open in full screen.
I'm finishing up the fourth year of my PhD, meaning that I've spent a fair amount of time reading papers over the past few years. In my first year, I decided I was going to try to stay consistent with the way that I read and took notes on papers, so it would be easier to look back when I needed a quick reference. To that end, I created a private wordpress.com blog, and everytime (ok, most times) I read a paper, I'd take some quick notes as a Wordpress post. Each post contains a few bulletpoints about the content of the paper, my take, author names, a link to the paper, a few tags (e.g. birdsong, langauge, machine learning), plus screenshots of the main figures that I want to remember. It only takes <1 minute to add the extra metadata, and makes it much easier to index.
The main benefit for me is that when I'm trying to remember a paper I read recently, I can either search for it on my blog, or scroll down the page. In addition, I keep other notes, research idea, or even links to websites I like or resources I find useful as posts on the site as well. I categorize them all as either papers, datasets, research ideas, etc. If you're a new graduate student, or just someone looking for a good easy way to take notes, I recommend it. It's nice to have an easy cloud-based WYSIWIG editor for notes, as compared to this blog (timsainburg.com), where every post is a Jupyter notebook.
Now that I've got quite a few papers on there (still fewer than I should / would have liked), it seems like a good time to look back through and reflect on what I've been reading over the years. Plus, quick, fun datascience/dataviz project.
General stats
- In total, I've created around 600 posts
- Posts are tagged with 1,768 different tags, 543 of which are unique.
- The 10 most frequent tags are:
'syntax', 'Birdsong', 'hierarchy', 'Language', 'Language Acquisition', 'sequence learning', 'Recursion', 'zebra finch', 'vocalization', 'Markov Models' - 58% of tags are unique
Creating a network
I subsetted those ~600 posts, taking only posts about research papers/chapters/etc. I then created a network in (using NetworkX) of my posts. To do so, I converted the XML data from Wordpress's RSS feed (you can do this pretty easily with any RSS feed).
In the network, each post is a single node, and the links between nodes are whether or not any two pairs of posts have overlapping tags. The weight of the edges (links) is computed as $\sum^{tag}_{tags}{\frac{1}{freq_{tag}}}$, where $tags$ are set of overlapping tags between the two nodes, and $freq_{tag}$ is the frequency of each tag occurring in the set of all tags. The point being that less frequent tags should be weighted as more important connections.
Clustering the network
I clustered using the community package for python, based upon the Louvain algorithm. The algorithm found 9 clusters, which correspond to each of the colors in the graph above. Here are a few example clusters:
Cluster #1: machine learning
- adversarially learned inference
- infogan: interpretable representation learning by information maximizing generative adversarial nets
- improved techniques for training gans
- auto-encoding variational bayes
- autoencoding beyond pixels using a learned similarity metric
Cluster #2: developmental speech/langauge
- a role for the developing lexicon in phonetic category acquisition.
- phonological parsing in speech recognition
- infants′ sensitivity to the sound patterns of native language words
- unsupervised segmentation of audio speech using the voting experts algorithm
- infants' preference for the predominant stress patterns of english words
Cluster #3: birdsong and neuroscience
- zebra finches exhibit speaker-independent phonetic perception of human speech
- the natural history of sound localization in mammals – a story of neuronal inhibition
- reconstructing speech from human auditory cortex
- neural lateralization of vocal control in a passerine bird
- precise auditory–vocal mirroring in neurons for learned vocal communication
Plotting
First I generated the positions of each node in the network using the Kamada Kawai method. I then plotted using the sigma.js package. To do so, I took the nodes and edges from my network and dumped it as a JSON for sigma.js to read, then put together the javascript and HTML to plot the network. You can see the results above.
A few takeaways:
- I would like to read more papers from a wider array of disciplines
- I need to take notes on more things that I read
- Most of the papers that I've read (or at least taken notes on) have fallen into the same five or six categories.
Here's a still of the what network should look like, in case you can't see it: